Reporting Visually and Interactively
P&G 2017 Citizenship Digital Report
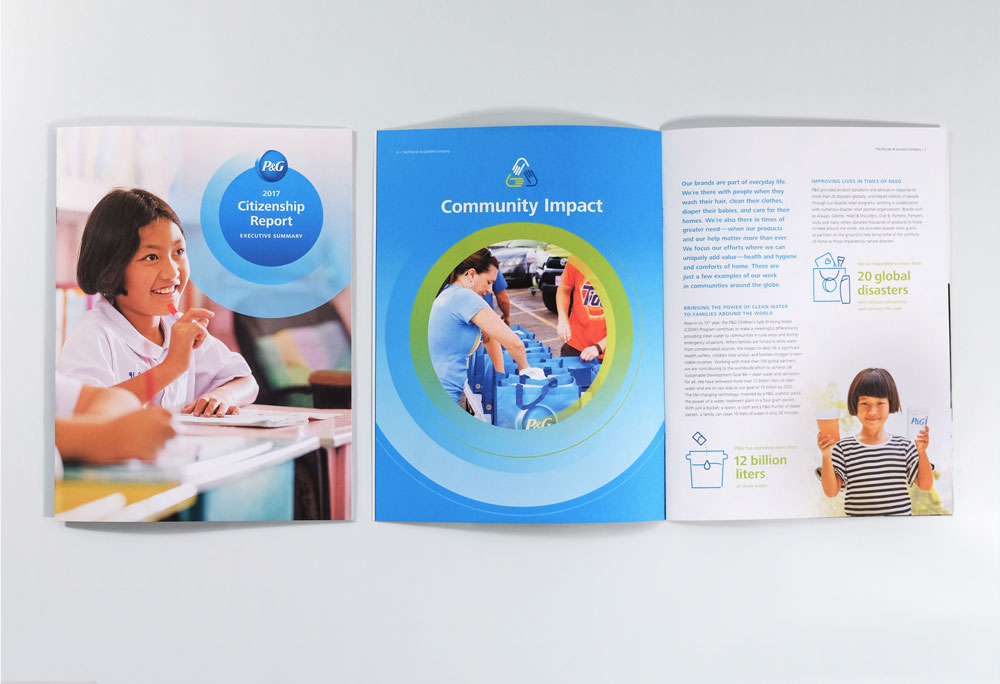
As a member of the design team for the printed companion to P&G's Annual Report—the Citizenship Report—my next step was the planning, layout, and implementation of the expanded, downloadable, digital version. While the format was moving to a non-linear, landscape experience, it was important to maintain the unique visual elements.
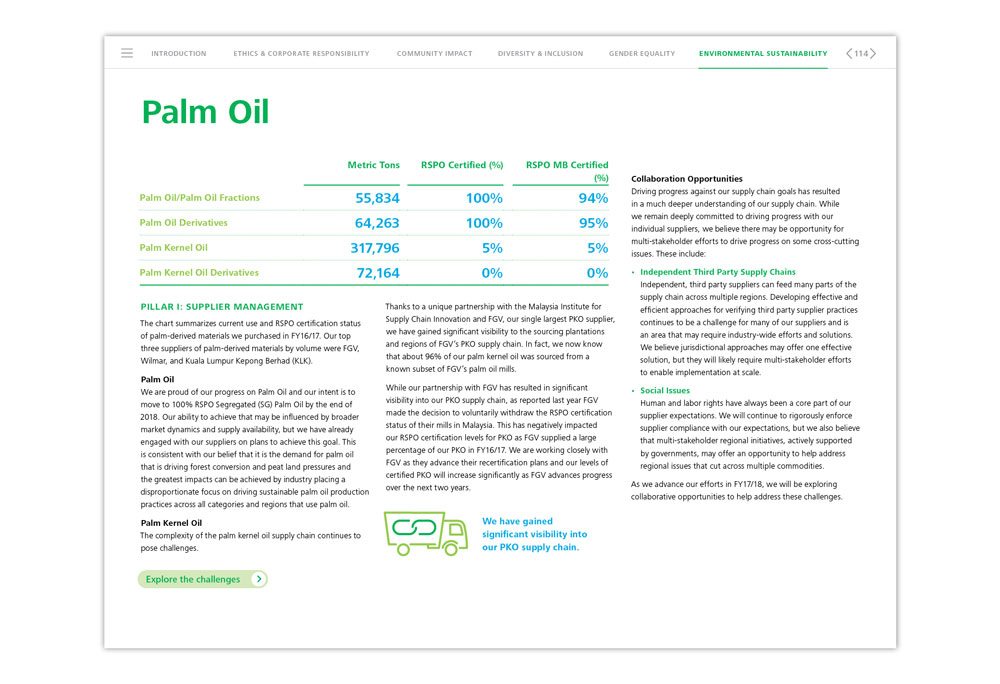
Because the amount of content was so vast, it was imperative to have user-friendly methods of navigating the document. In addition to a persistent navigation at the top, small and large buttons direct users to outside sources and further reading; buttons adapt to the color scheme of their section.
Multiple sections and numerous page types required visual cues and unique layouts to signal a change—all while respecting the underlying grid. In addition to overall design decisions, more granular responsibilities included content grouping, photography selection, and icon development.
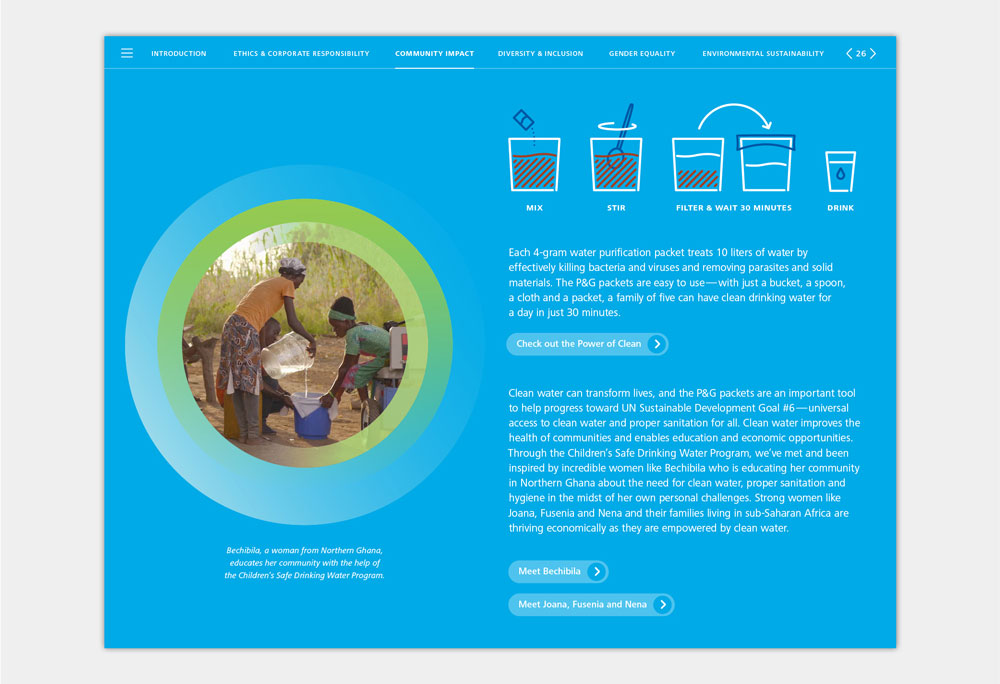
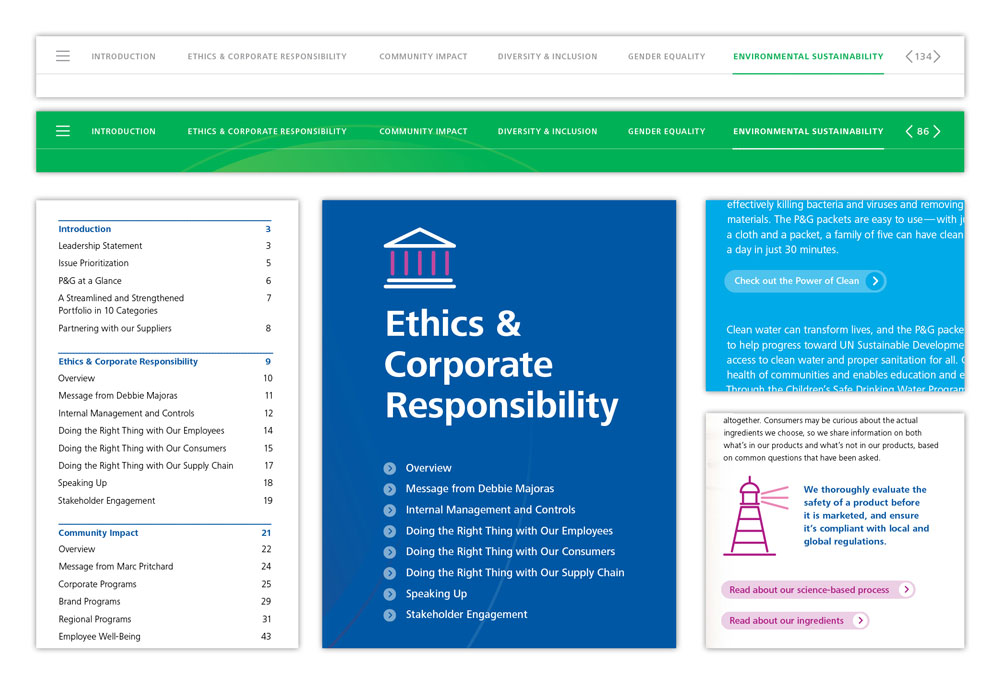
Every view of this 136-page report was a puzzle—each requiring a custom approach of how to combine iconography, call-outs, photography, buttons, charts, and tables. If you would like to experience the report yourself, you may download it from P&G's website.